3-D Shear Wave Velocity Model of Mexico and South US
This work presents the results obtained from the surface wave tomography for a region covering Mexico and the southern United States with a resolution of 0.4° on a square grid.
The tomography is obtained by using an innovative strategy to enhance the resolution obtained from ambient noise cross-correlation (C1) by bridging asynchronous seismic networks through the correlation of coda of correlations (C3). Rayleigh wave group dispersion curves show consistent results between synchronous and asynchronous stations.
Rayleigh wave travel times are inverted to construct group velocity maps at different periods.
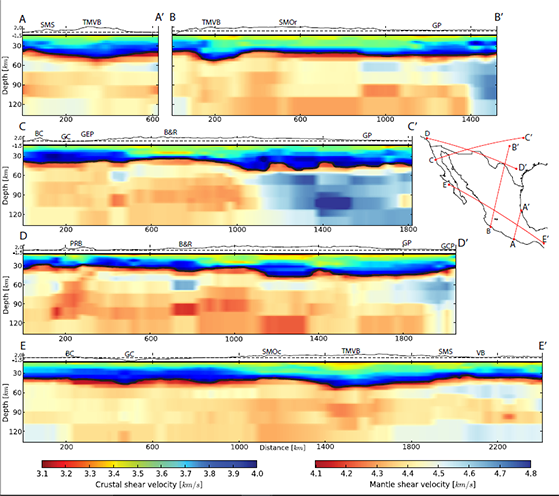
The resulting period maps are then used to regionalize dispersion curves in order to obtain local 1-D shear velocity models (VS) of the crust and uppermost mantle in every cell of the geographical grid. The 1-D structures are obtained by iteratively adding layers until reaching a given misfit, and a global tomography model is considered as an input for depths below 150 km. The latter allow to deal with the low-velocity zone of the upper mantle and improve the misfit at long period. Finally, a high-resolution 3-D VS model is obtained from these inversions.
The major structures observed in the 3-D model are in agreement with the tectonic-geodynamic features and with previous regional and local studies. It also offers new insights to understand the present and past tectonic evolution of the region. Paper
The tomography is obtained by using an innovative strategy to enhance the resolution obtained from ambient noise cross-correlation (C1) by bridging asynchronous seismic networks through the correlation of coda of correlations (C3). Rayleigh wave group dispersion curves show consistent results between synchronous and asynchronous stations.
Rayleigh wave travel times are inverted to construct group velocity maps at different periods.
The resulting period maps are then used to regionalize dispersion curves in order to obtain local 1-D shear velocity models (VS) of the crust and uppermost mantle in every cell of the geographical grid. The 1-D structures are obtained by iteratively adding layers until reaching a given misfit, and a global tomography model is considered as an input for depths below 150 km. The latter allow to deal with the low-velocity zone of the upper mantle and improve the misfit at long period. Finally, a high-resolution 3-D VS model is obtained from these inversions.
The major structures observed in the 3-D model are in agreement with the tectonic-geodynamic features and with previous regional and local studies. It also offers new insights to understand the present and past tectonic evolution of the region. Paper
Products
Raw profiles
- The 3-D model resulting from the inversion can be downloaded as a MATLAB file . It contains the positions of the center of the grid cells and the tensors Mh, Mrho, MVp, MVs which correspond respectively to the thickness, density, compressional and shear velocities at the cells location for the several layers considered.
- The 1st dimension is related to latitudes.
- The 2nd dimension is related to longitudes.
- The 3rd dimension is related to the layer number (1 is for the top layer).
Viewer
A viewer allows interacting with the 3-D model. It is a compiled MATLAB executable for Windows, Linux and Mac, which will install both the MATLAB runtime (if required) and the viewer software. It allows viewing and extracting:- Period maps
- Local 1D profile on any point of the grid along with the associated dispersion curves (target and best-fit) as well as the dispersion curves obtained from a previous study (Gaite et al., 2015).
- Vs velocity model. Both depth maps and cross-section between two points of the grid are extractable. 3D box of the Vs model. Draw a box on the map and extract this part of the model.
- Map of the misfit.
Spica, Z., Perton, M., Calò, M., Legrand, D., Córdoba-Montiel, F. and Iglesias, A., 2016. 3-D shear wave velocity model of
Mexico and South US: bridging seismic networks with ambient noise cross-correlations (C1) and correlation of coda of
correlations (C3). Geophysical Journal International, 206(3), pp.1795-1813, doi:10.1093/gji/ggw240